Human activities are causing widespread physical disturbances (like plowing) while also increasing the supply of growth-limiting nutrients, such as nitrogen (N) and phosphorus (P). Although this is happening on all of Earth’s continents, we don't have a clear way to predict how the plants and soils in different places will respond to these changes. Studies show that even in similar places, plant communities and ecosystems can respond differently to disturbances and changes in nutrients, but we do not yet understand what causes these differences. The goal of the DRAGNet (Disturbance and Recovery Across Grasslands Network) experimental network is to quantify how plant communities in grasslands respond to – and recover from – repeated disturbances and chronically elevated nutrients.
The DRAGNet experiment at CDR LTER is one of the identically replicated experiments being conducted in dozens of grasslands in different parts of the world, including sites in Asia, Africa, Australia, Europe, North America, and South America. The scientists at each site are conducting identical experiments, manipulating soil disturbances and nutrient supply, to answer pressing ecological questions about the response of global grassland plants and soils to human-induced physical and elemental changes.
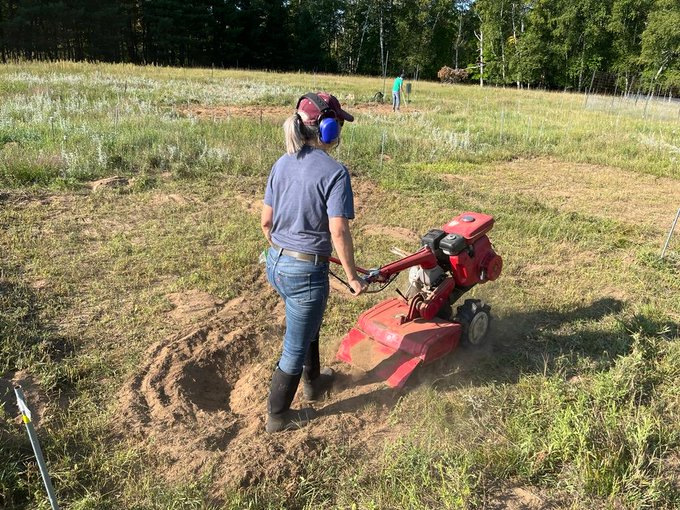
PI Elizabeth Borer applies the disturbance treatment via rototiller in the DRAGNet experiment at Cedar Creek.
Experiment Design
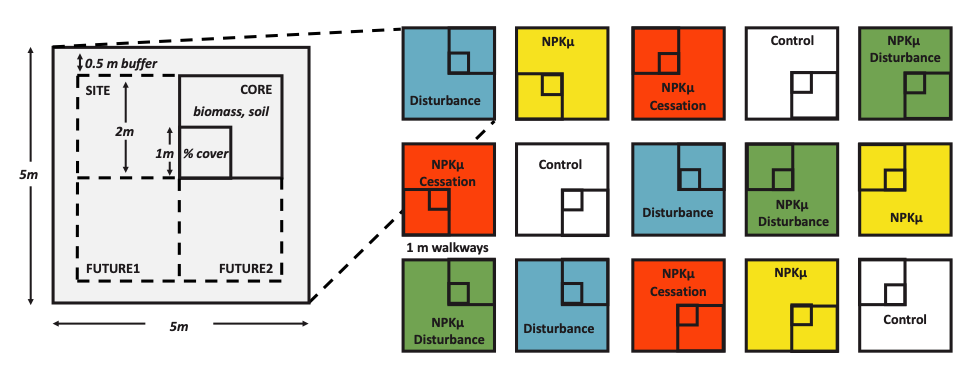
Established at Cedar Creek in 2021, the DRAGNet experiment consists of a set of 3 completely randomized blocks (within-site spatial replicates), each with five, 5 x 5 m plots receiving either: long-term nutrient addition; a physical disturbance (annual removal of standing vegetation, litter, rhizomes and tilling of the soil); nutrient addition combined with disturbance; short-term (5 year) nutrient addition; or no treatments (controls). The core response variables will be plant species composition, aboveground standing crop, light intercepted by the plant canopy, and soil chemistry. There is also a seed-bank and seed-rain study.
Nutrient Addition (NPKμ)
To assess nutrient limitation at each site, we will apply a combination of Nitrogen (N), Phosphorus (P), Potassium (K) and micronutrients (μ). We will add nutrients in the same rates (10 g m-2 each of N, P and K) and in the same forms as in the “NPKμ” treatment in NutNet.
Disturbance
To create the conditions for community re-assembly to occur, we will kill all adult plants including perennials and disturb the soil from pre-treatment conditions in a subset of plots. This will be accomplished by clipping or mowing all standing biomass; tilling the soil; and removing large rhizomes. Unlike the nutrient addition treatment, which is defined by its application rates, the disturbance treatment is defined by its desired effects on the standing plant community. We are less concerned about the exact methods used to produce the disturbance, as these will be determined by the logistical constraints posed at each site. The disturbance will be repeated annually for three years.
Nutrient Addition + Disturbance
To determine whether nutrient addition affects the rate or trajectory of community assembly, a subset of plots will receive both nutrients and a disturbance treatment (see above). In these plots, disturbance will only be applied for the first three years, while nutrients will be applied annually for the duration of the experiment immediately after the disturbance.
Nutrient Cessation – starting in Year 5
To evaluate the resilience of grassland plant communities to eutrophication and to compare resilience of plant communities to nutrient addition and disturbance, a subset of plots will receive nutrients for only the first five years of the experiment.
Schematic of the experiment, showing a hypothetical random arrangement of plots and subplots.
Further information is available on the DRAGNet website.
Core Sampling
In each plot, the core sampling 2.5 by 2.5 m subplot is divided into four 1 by 1 m permanent subplots, surrounded by a 0.25-m buffer. Within the core-sampling subplot, one 1-m2 subplot is permanently marked for annual plant composition sampling; the other three are used for destructive biomass sampling. Core annual sampling includes clipping of total above-ground biomass of all plants rooted within two 0.1-m2 strips (10 by 100 cm) for a total of 0.2 m2. These are sorted to live and dead (or further, e.g. forb, grass, moss at many sites), dried at 60 degrees C to constant mass and weighed to the nearest 0.01 g. Leaves and current years woody growth are collected from shrubs and subshrubs.
Light availability above and at ground level below the canopy is measured in the core subplot using a linear 1-m bar (e.g. Apogee Instruments, Inc., Logan, UT, USA). Areal cover is estimated to the nearest 1% for each species rooted in the core subplot; cover estimates include woody overstorey, litter, bare soil, rock and animal activity (e.g. digging).
All core measurements are collected from all plots, annually at peak biomass. Two 2.5 cm diameter by 10 cm depth soil cores, free of litter and vegetation, are collected from each plot prior to initiation of the experiment (Y0) and 3 years after treatment initiation (Y3).
Soils from each plot are composited, homogenized, air-dried and shipped to a single laboratory for analysis and long-term storage. Samples are assayed for % total C and % total N, extractable soil phosphorus, potassium and micronutrients, soil pH, soil organic matter and soil texture.
Sampling protocols are identical to those developed for the Nutrient Network (NutNet), which are described in Borer, E. T., W. S. Harpole, P. B. Adler, E. M. Lind, J. L. Orrock, E. W. Seabloom, and M. D. Smith. 2014. Finding generality in ecology: a model for globally distributed experiments. Methods in Ecology and Evolution 5:65-73. doi.org/10.1111/2041-210X.12125
Treatment Tables
Download treatment tables (zip file)