Experiments 001 & 002 were established in 1982 to examine interactive effects of nitrogen addition (0-27.2 g N m-2 yr-1) and soil disturbance (tilling) on low-fertility grassland ecosystems. Both experiments have identical nutrient addition treatments, however E001 was started in an undisturbed grassland while E002 was disked with a tractor at the start of the experiment. This pair of experiments are replicated in three old fields (A, B, and C), and E001 is replicated in an additional field (D). These experiments were the first multi-decadal experiment to examine the impacts of chronic, experimental nitrogen addition as low as 1 g of N per m2 per year above ambient atmospheric nitrogen deposition (6 g of N per m2 per year). This total input rate is comparable to terrestrial nitrogen deposition in many industrialized nations.
Plots in E002 were sampled nearly annually for above-ground biomass (sorted by species) for the first two decades in all fields, however sampling is now periodic. Over the course of this experiment, new treatments have been imposed (Figure 1). In 1986, aluminum flashing was buried between the individual plots to prevent plants from spreading by vegetative reproduction. Initially, the plot grids were enclosed by fencing to exclude large mammalian herbivores, however in 2004 this was removed. Gophers are trapped and removed. In 1992, two modifications were made to the Experiment 002 treatment regime. In two of the three fields (A & C), cessation treatments were initiated with all nutrient addition being discontinued for half of the replicates. These were renamed as Experiment 097. In 2014 fertilization was stopped for a portion of every plot that had been continually fertilized , except for treatment "I" (which is a non-fertilized treatment). In the third field (B), fertilization treatments are ongoing, but half of the replicates are burned annually, renamed as experiment 098. Since 2011 work in all plots in the E002 field are being recorded under experiment number E002. See Figures 1 thru 4.
Figure 1. Timeline of treatments in E002.

Figure 2. E098 (E002) -Field A

Figure 3. E098 (E002) -Field B

Figure 4. E097 (E002) -Field C

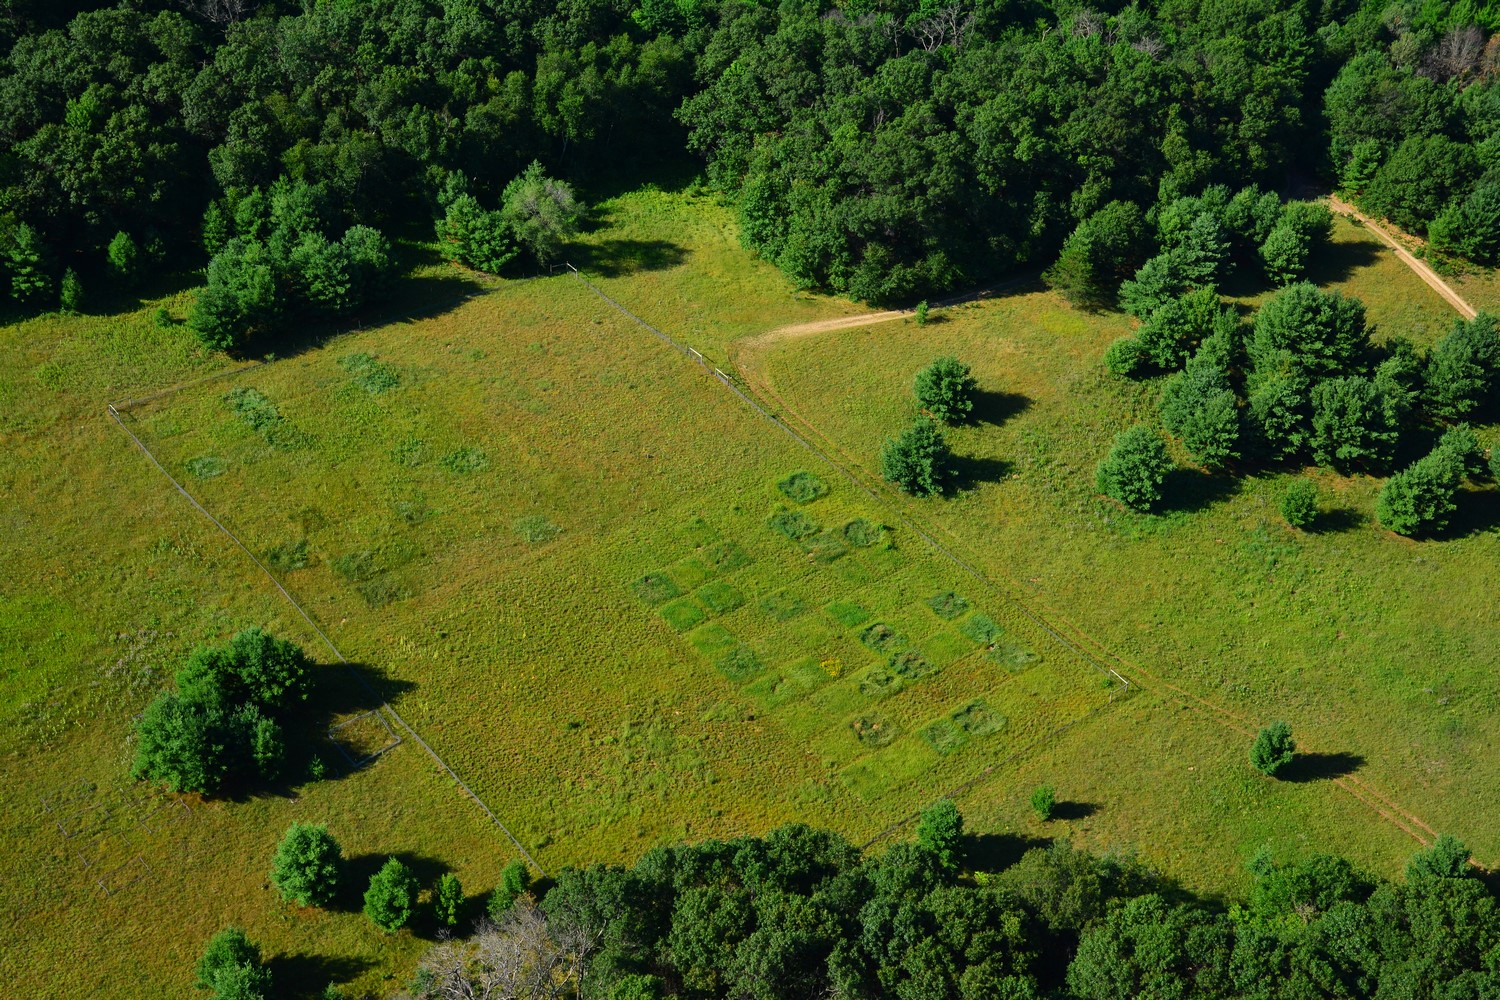
Experiment Design
from: Tilman, G. D. (1984) Plant Dominance Along an Experimental Nutrient Gradient. Ecology, 65(5), 1445-1453. doi:Doi 10.2307/1939125
Nutrient Addition
The nutrient-addition treatment has nine levels representing different combinations of Nitrogen (0–27.2 g N year−1 added as NH4NO3) and Other Nutrients (20 g m−2 year−1 P205;20 g m−2 year−1 K20; 40 g m−2 year−1 CaCO3; 30.0 g m−2 year−1 MgSO4;18 μgm−2 year−1 CuSO4; 37.7 μgm−2 year−1 ZnSO4; 15.3 μgm−2 year−1 CoCO2; 322 μgm−2 year−1 MnCl2; and 15.1 μgm−2 year−1 NaMoO4).. Nutrients are applied twice per year in mid-May and mid-June. (Tilman 1984)
Nutrient Cessation
In 2014 we stopped fertilizing a portion of every plot that had been continually fertilized , except for treatment "I" (which is a non-fertilized treatment). A total of 48 plots. We split every plot into 2, the side we continue to fertilize (no shading) is 1.Sm X 4m and the side we stopped fertilizing is 2.Sm X 4m. What side we placed the 1.Sm X 4m fertilized side was randomly assigned by a coin flip. In the third field (B), fertilization treatments are ongoing, but half of the replicates are burned annually Renamed as experiment 098.
Fencing and flashing
The plots were originally enclosed by a fence to exclude mammalian herbivores; this fencing was removed in fall of 2004. Galvanized welded-wire hardware cloth with 6mm x 6mm openings was buried to a depth of 84cm. Additional hardware cloth extended 60cm above the ground, and poultry netting extended to 1.8m above the ground. During the summer of 1986, aluminum flashing was placed in the ground to a depth of 12 inches. This flashing surrounds each plot in each field, keeping the plants from spreading between plots by below-ground vegetative reproduction.
Burning Methods
In the spring of 1992, 3 randomly chosen replicates of each nutrient treatment of E002 in field B were chosen to be burned each spring. In preparation for burning, the perimeter of groups of plots to be burned is mowed using a lawn mower. The cuttings and litter remaining are raked into the area to be burned. This firebreak is then reinforced by wetting the cropped vegetation with a high pressure water hose attached to a 125 gallon water tank. A backfire is started to widen the firebreak. A drip torch is then used to start the groups of plots (one at a time) on fire. On May 5, 1995, a wildfire burned all plots in experiment 002 in field B.
Treatment Tables
Download treatment tables (zip file)
Data
Select Publications
Plant dominance along an experimental nutrient gradient
GD Tilman
1984 Ecology 65 (5), 1445-1453
Loss of plant species after chronic low-level nitrogen deposition to prairie grasslands
CM Clark, D Tilman
2008 Nature 451 (7179), 712-715
Soil carbon sequestration in prairie grasslands increased by chronic nitrogen addition
DA Fornara, D Tilman
2012 Ecology 93 (9), 2030-2036
Low biodiversity state persists two decades after cessation of nutrient enrichment
F Isbell, D Tilman, S Polasky, S Binder, P Hawthorne
2013 Ecology letters 16 (4), 454-460
Disturbance alters transience but nutrients determine equilibria during grassland succession with multiple global change drivers
MH DeSiervo, LL Sullivan, LM Kahan, EW Seabloom, LG Shoemaker
2023 Ecology letters