The long-term forest biodiversity experiment (FAB2), is designed to expand the capacity and scope of FAB1, established in 2012. Like its predecessor, FAB2 focuses on trees of our region, tested for survival and growth at Cedar Creek. We designed the FAB2 experiment to determine the influence of tree diversity and composition on long-term community processes and ecosystem function and resilience. Our main objective is to experimentally test hypotheses that generate insights to inform forest restoration. We are specifically interested in understanding the importance of 1) species and lineage effects and 2) tree diversity for other trophic levels and for ecosystem functions; and in 3) deciphering the mechanisms by which tree species influence each other with consequences for ecosystem processes. Consequently, we are examining influences of tree composition and diversity on the abiotic environment including resource availability and stress, as well as cascading impacts on biotic processes, including herbivory and microbial processes. In addition, we are developing remote sensing approaches for cost-effective long-term measurement of growth, survival, structure, phenology, and ecosystem processes. Our aim is to use relatively inexpensive (multispectral, thermal, LiDAR) and advanced (hyperspectral) sensors on UAV platforms to characterize phenological changes in forest structure and canopy chemistry to test our hypotheses. We are using this remotely sensed information to model multiple dimensions of biodiversity as well as ecosystem productivity and will relate them to belowground processes such as soil nutrient availability and soil processes. We anticipate variability among assemblages in when canopy closure occurs with consequences for the timing and rate of influence on soil processes.
Experiment Design
Plot diversity treatments
Species Richness | Plot Type | Repetitions |
1 | monocultures | 36 |
2 | species mixtures | 46 |
4 | species mixtures | 46 |
6 | species mixtures | 10 |
12 | species mixtures | 10 |
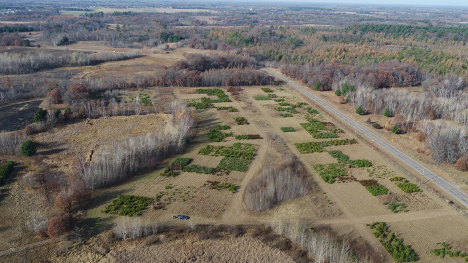
148 plots 10m x10m were planted to include Monoculture ecosystems to test species specific effects. In addition, there are 36 20m x 20 m plots randomly dispersed in the matrix of smaller plots. These include three replicated monocultures of each of the twelve species. In addition, five 20 x 20 m plots will include all of the 12 species. These plots are also randomly dispersed in the matrix, and each species was randomly planted within a plot. Spacing. Seedlings were planted 1 m apart without rows between plots. The experiment has some spacing around and between blocks to allow for irrigation pipe and access roads. A detailed image and map, Map of FAB 2 plots, depict the site design.
Species
FAB 2 includes the same 12 species as FAB 1: eastern redcedar (Juniperus virginiana), white pine (Pinus strobus), red pine (P. resinosa), jack pine (P. banksiana), red oak (Quercus rubra), pin oak (Q. ellipsoidalis), white oak (Q. alba), bur oak(Q. macrocarpa), red maple (Acer rubrum), boxelder (A. negundo), paper birch (Betula papyrifera); and basswood (Tilia americana). A total of 31,200 trees were established.
Seed collection was designed to keep track of maternal family for five species (Acer rubrum, Betula papyrifera, Quercus ellipsoidalis, Q. macrocarpa and Q. rubra). Seedling origin. All seedlings planted in the FAB2 experiment had original seed sources from upper Midwestern states, (MN, ND, MI, and IA).
Map of FAB 2 plots
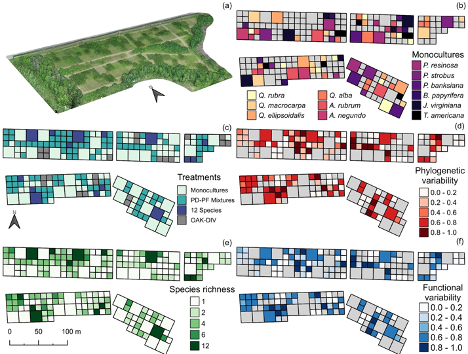
Experimental design of the Forest and Biodiversity Experiment 2 at the Cedar Creek Ecosystem Science Reserve. a) A LiDAR image during summer 2022. b) Number of species in each plot. b) Plots with monocultures. c and d show the phylogenetic and functional variability (PV-FV). In the case of functional diversity, a dendrogram from a suite of scaled traits was used (see methods).
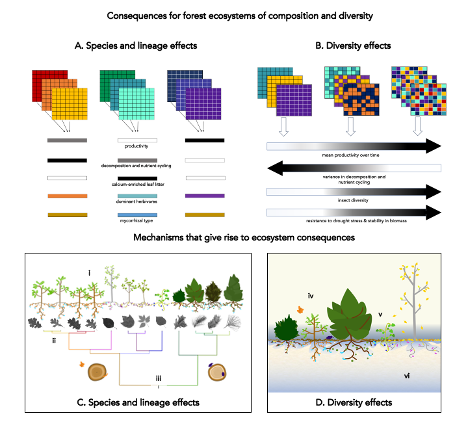
The forest and biodiversity (FAB2) experiment is designed to test consequences of tree species and lineages and of tree diversity for ecosystem functions and other trophic levels and to uncover the mechanisms underlying these effects. Clockwise from top left: A shows the consequences of species and lineage effects of closely related monocultures in three lineage groups. Closely related species will exhibit similar patterns in productivity, decomposition and nutrient cycling, calcium-enriched leaf litter, dominant herbivores, and mycorrhizal type. B Examples of the consequences of tree diversity treatments ranging from varied monocultures (left) to bicultures of different phylogenetic and functional similarity (middle) and higher diversity treatments (right). With greater tree diversity, mean productivity is expected to increase, variance in decomposition and nutrient cycling is expected to decrease, local insect diversity is expected to increase and resistance to drought and the stability of biomass in forest ecosystems are expected to increase. C shows the mechanisms underlying species and lineage effects associated with the experimental design. Included in the tree diversity experiment are twelve tree species native to Minnesota that span a wide range of phylogenetic and functional diversity. From left to right: Quercus macrocarpa, Q. alba, Q. rubra, Q. ellipsoidalis, Betula papyrifera, Acer rubrum, A. negundo, Juniperus virginiana, Pinus resinosa, P. banksiana, P. strobus. The experimental design enables the study of (i) plant functional traits and intrinsic growth rates, (ii) host specificity and co-evolutionary acquisition of symbionts, including bacterial and fungal partners, and (iii) the deep evolutionary divergence in wood and leaf structural properties and their consequences for ecosystem processes. D depicts the mechanisms underlying tree diversity effects that can be studied in the experiment. These effects include (iv) dilution effects, (v) phenological offsetting in light and nutrient use, and (vi) facilitation through shading and soil moisture maintenance.
Site Preparation and Planting
FAB2 was planted in 2016. Preparation included burning the area, cutting and removing existing trees, stump grinding, tilling entire field with a rototiller, spraying Glyphosate, building an 8 foot tall deer fence, installing 6 inch aluminum irrigation pipe, installing a high pressure well with electronic control board, purchasing two Kifco T200 water reel irrigation units, and building bridges over a stream and irrigation pipes. Tree Planting. The majority of tree planting took place over a two year period to ensure trees were planted during great conditions, and reduce the risk of unforeseen negative environmental conditions (eg. a drought). Planting of the small plot diversity treatment (10 x 10 m plots), which included the planting of maternal lines, took place in April 18th to May 13th 2016. The large plots (20 x 20 m) were planted in April 14th to May 5th 2017. Replanting of dead seedlings took place from 2018 to 2021. Seedlings will be established for a long-term experiment of indefinite length.
Mortality was high, particularly in the large monoculture plots, given three consecutive years of drought, particularly for Tilia americana and Acer negundo.
Treatment Tables
Download treatment tables (zip file)